Talent dashboards
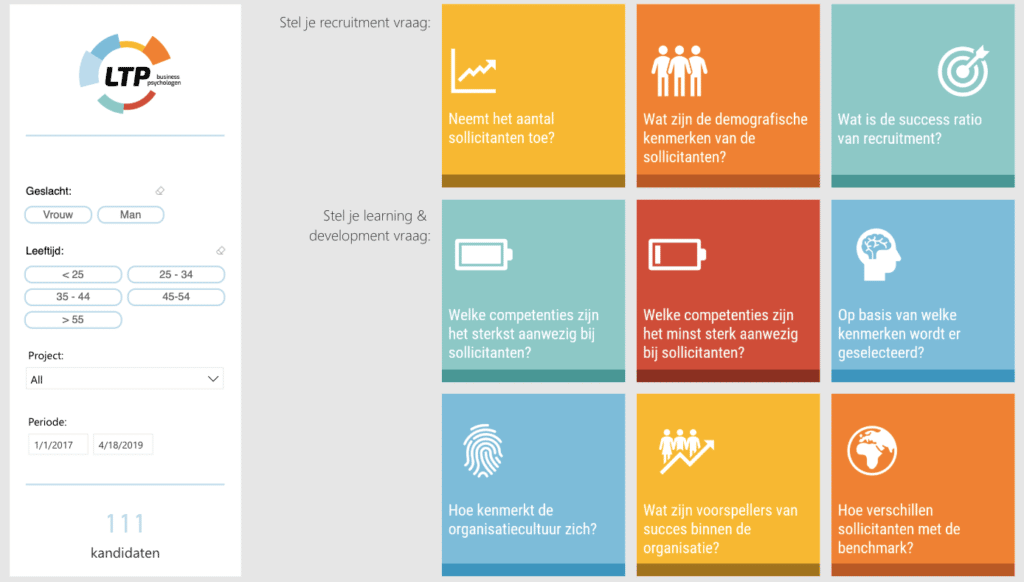
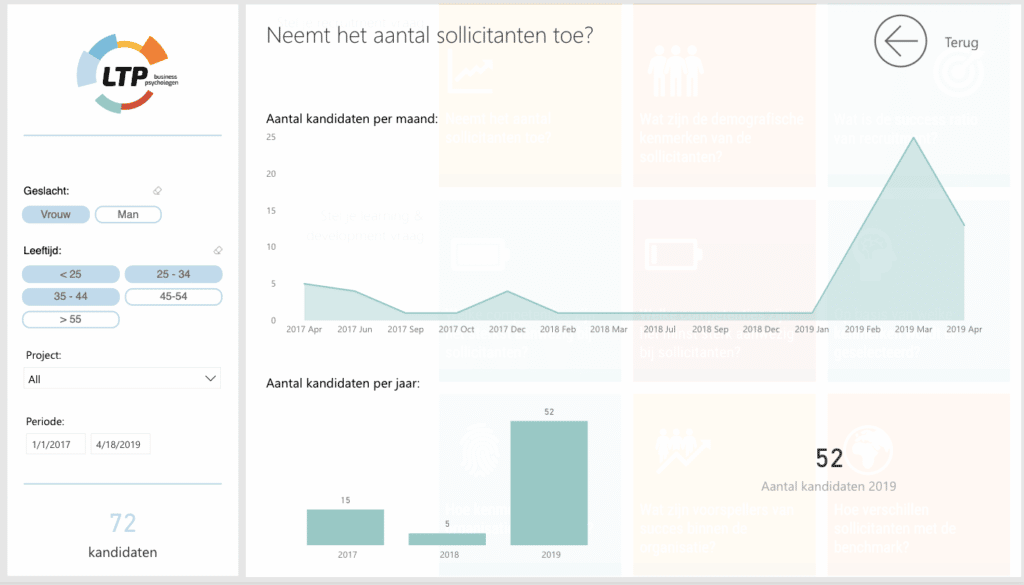
Gain insight into the candidate characteristics and scores.
Select the features that are relevant to you and the interactive dashboard will give you the information you are looking for.
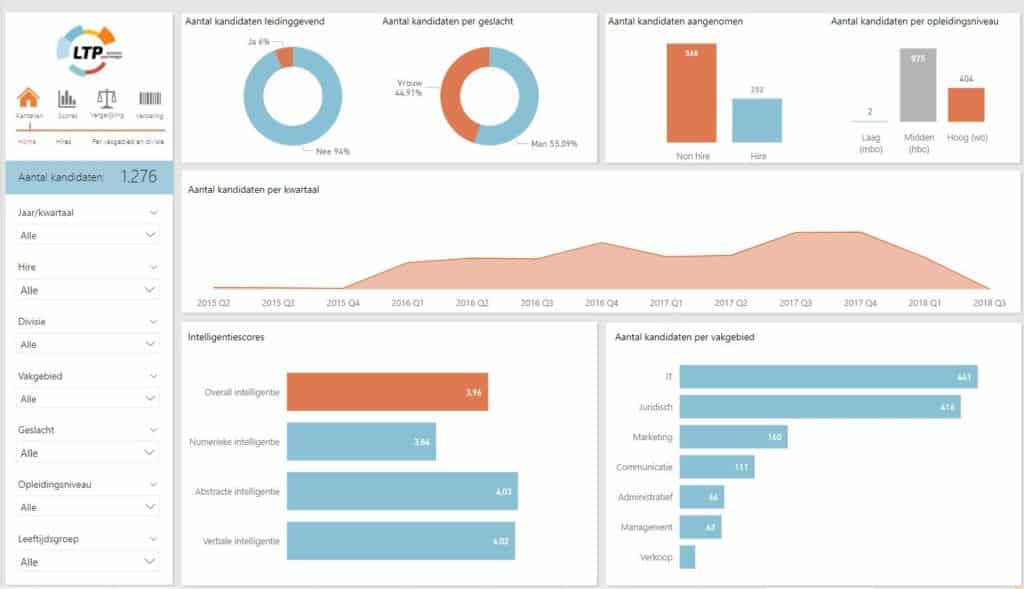
Compare different disciplines, function groups or regions with each other. Is there a difference between different traineeships? Are more people employed in one region than in another?
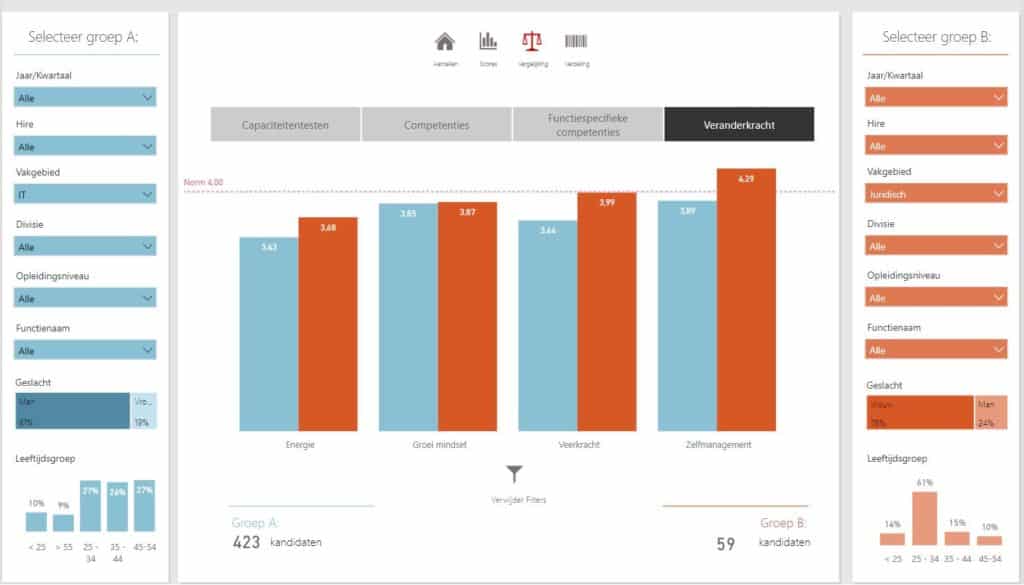
Compile relevant groups yourself.
Do you want to compare candidates on the basis of gender, or rather on the basis of their professional field? Or both? Do women in IT score higher on numerical intelligence than men? This flexible dashboard allows you to choose which groups you want to compare and you gain insight in your data on the fly.
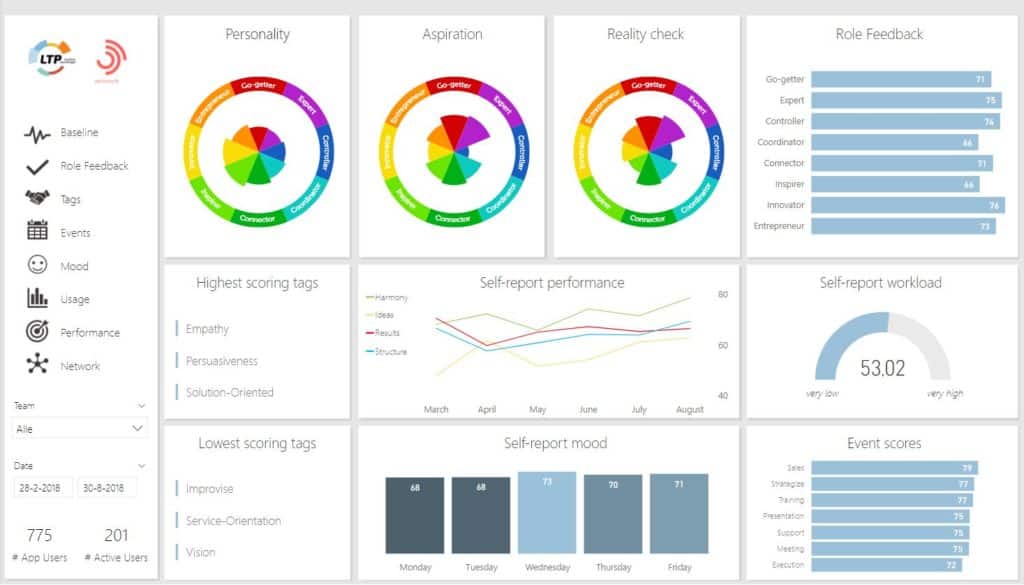
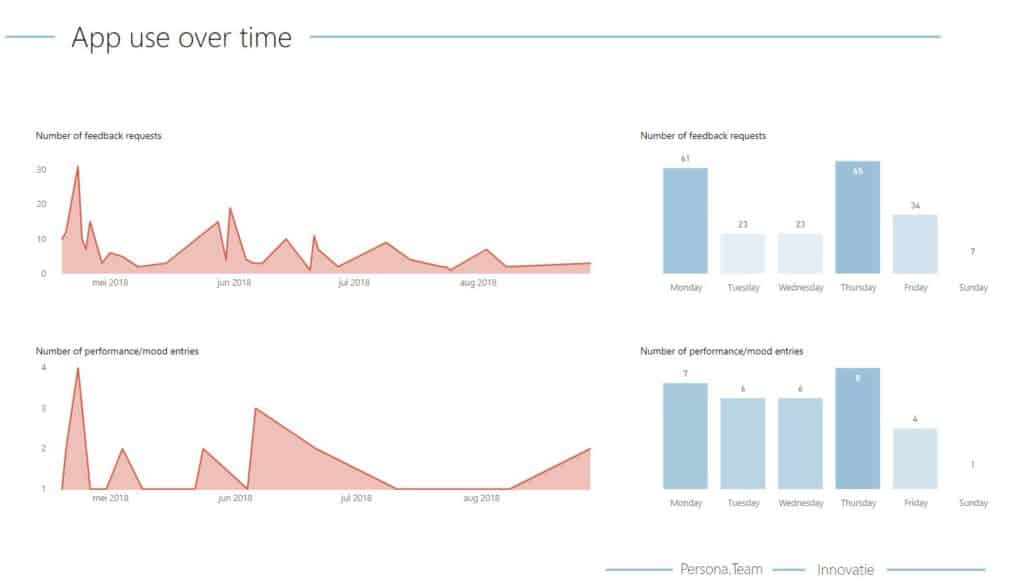
It is also possible for users of the feedback app Persona.fit to display the data in a dashboard. This is very useful for team sessions, for example, or to steer on continuous feedback. In which teams is feedback often requested? How are energy levels during the working week?
